
Key Takeaways
- In recent years and especially since the COVID-19 pandemic, secondary and tertiary markets have become attractive to developers, investors, and renters, due in part to increased affordability, better quality of life, and business-friendly governments.
- Nashville is one example of a flourishing secondary market that continues to experience population growth, attracting people with its’ diversified economy, lively music culture, nearby natural beauty, and relatively affordable cost of living.
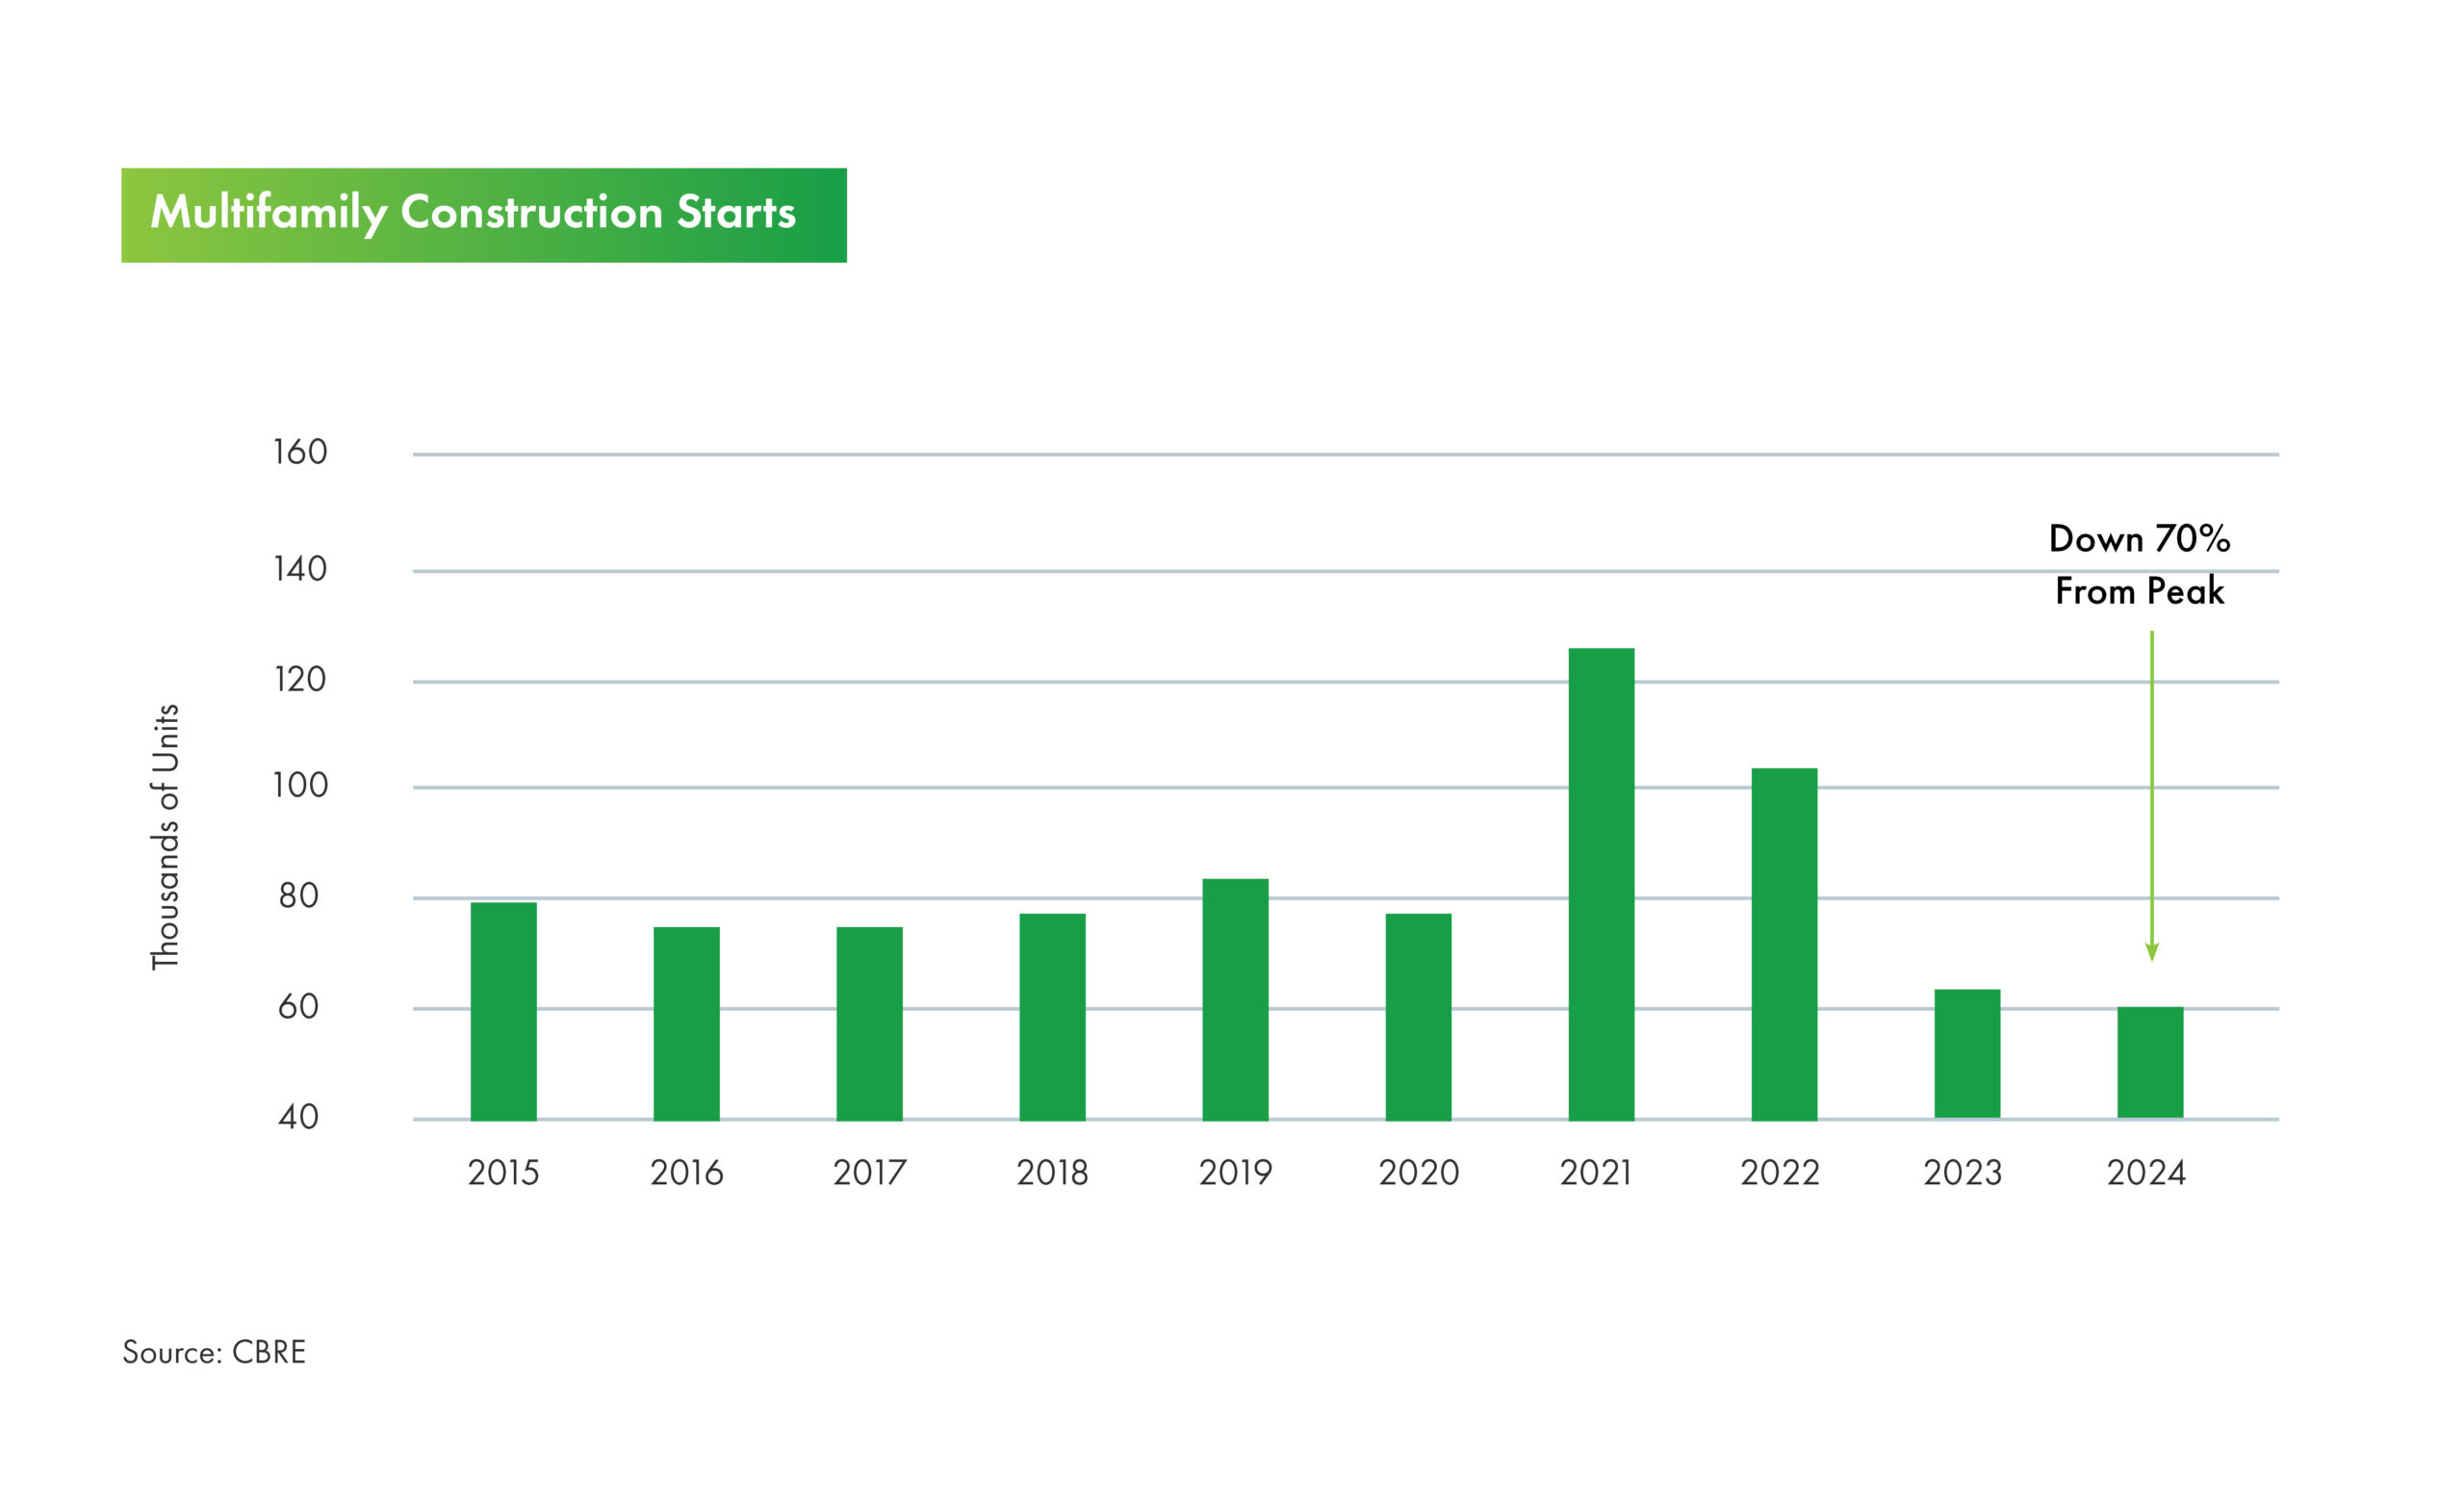
- Dramatic increases in financing and construction costs beginning around 3Q 2022 led to a decline in starts, and the highest level of supply pressures are now decreasing as demand has caught up, slightly over two years after the peak of construction starts.
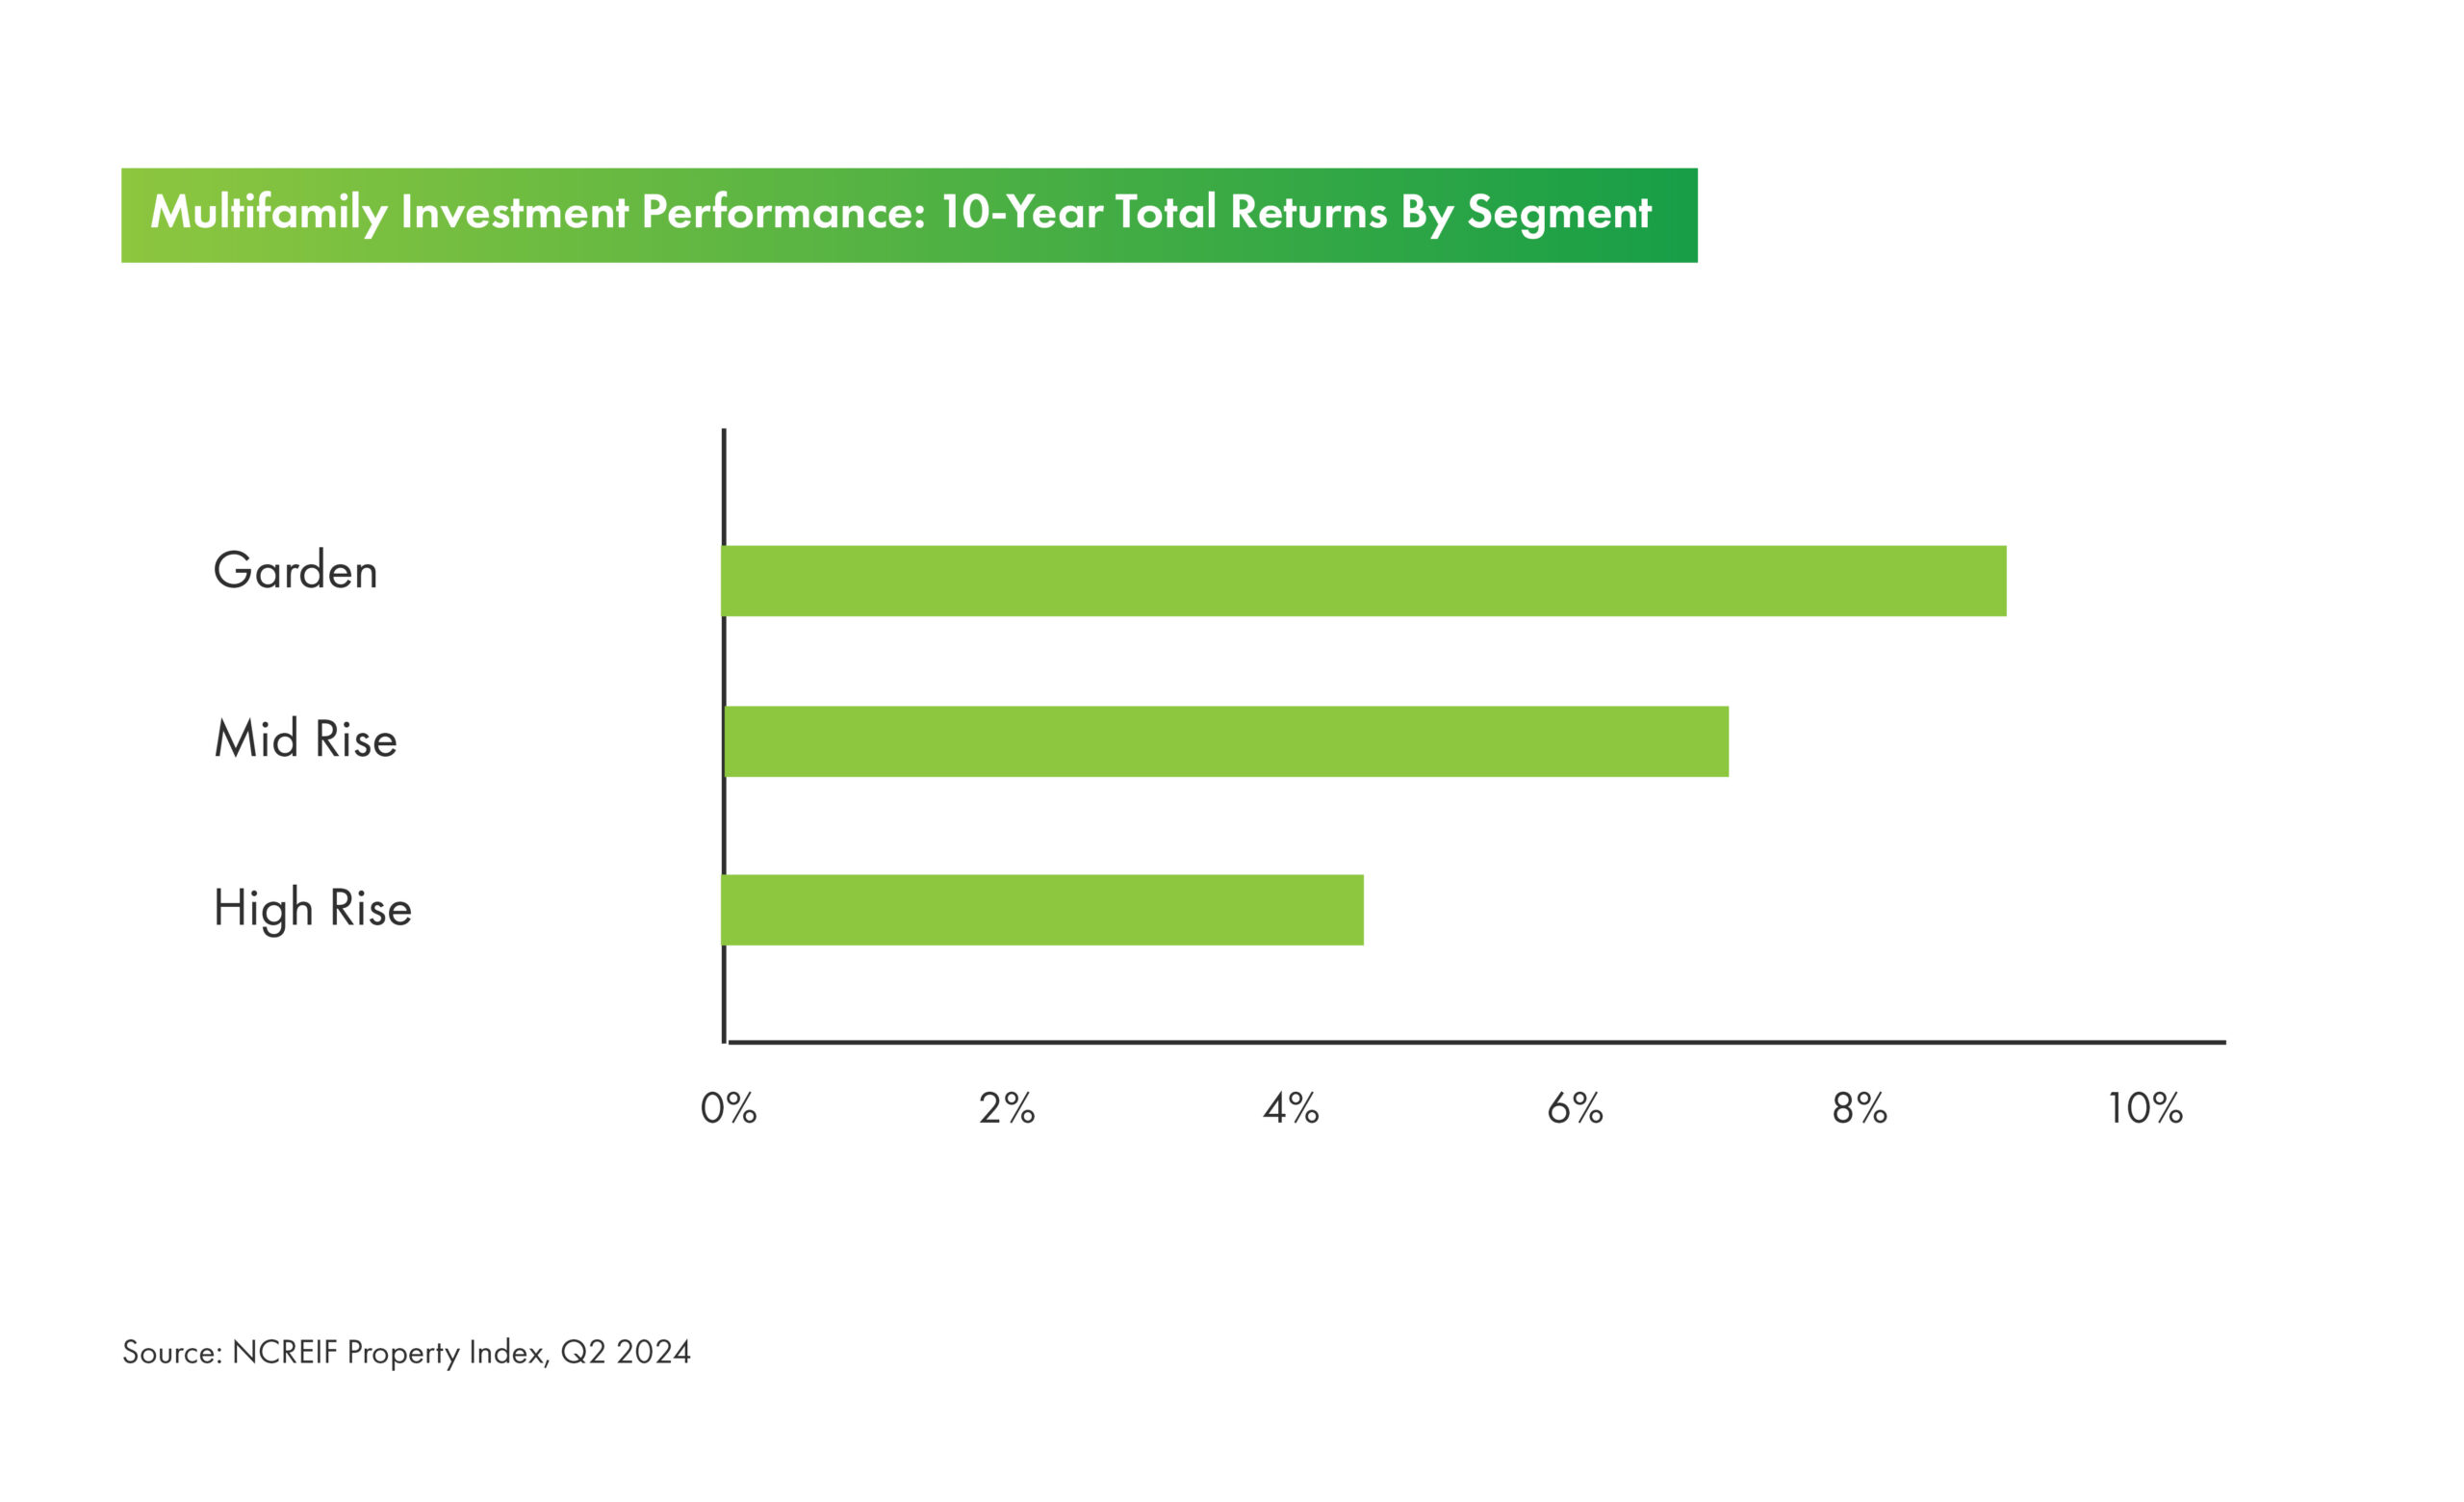
- Garden-style multifamily properties are prevalent in secondary and tertiary markets, especially in the southeast, and offer investors lower operating costs and predictability in underwriting.
- A large presence in a market or region can provide significant economies of scale for investors – particularly important in secondary and tertiary markets, allowing for consolidation of property management and purchasing power with vendors.
- While the multifamily market faced short-term stresses from elevated supply and broad economic volatility, demographic tailwinds and consumer preferences should deliver strong longer-term performance for multifamily properties in secondary and tertiary markets.
Characteristics of Growth Markets
There are over 50 metropolitan statistical areas (MSAs) in the United States. Only five to seven are primary, or “gateway” markets, such as New York and Los Angeles. The remainder are designated secondary and tertiary markets.
Secondary markets are cities that are slightly smaller than primary markets, with populations between one and five million. They have slightly less economic activity but can experience significant population growth. These regional hubs with diverse industries are in-migration locations for investors and businesses. They offer many of the same amenities and features as primary markets, while being more affordable and less densely populated. Examples of popular secondary markets include Nashville, Orlando, St. Louis, and Minneapolis.
Tertiary markets typically have populations under one million, and are demonstrating steady, controlled job growth. They may have a smaller urban center, and lack the public infrastructure found in primary and secondary markets. The population is usually more widespread in suburban areas. Similar to secondary markets, they offer a lower cost of living. Examples of popular tertiary markets include Ann Arbor, Kansas City, Chattanooga, and Des Moines.
Affordability
Housing costs for both renters and buyers are significantly lower in secondary and tertiary markets. Despite generally lower household income levels, many consumers have more disposable income largely because of lower housing costs.
Business-friendly Policy
Many secondary and tertiary markets have promoted existing or adopted new business-friendly policies, including lower taxes and streamlined regulations. Many employers have established new campuses to access the workforce in these markets.
Quality of Life
Residents can afford more living space and be closer to nature – quality of life priorities accelerated by the pandemic.
Infrastructure
Investments in hard infrastructure including roads, broadband, and public utilities, and soft infrastructure including parks and recreation, and healthcare are making secondary and tertiary markets increasingly desirable and accessible.
Education
Many secondary and tertiary markets host a major university that supply a skilled, educated workforce to prospective employers.
Case Study: Nashville, Tennessee
Nashville, Tennessee, is world-renowned for its association with country music, but has diversified its economy significantly in recent years. Numerous major corporations including Nissan, Bridgestone, HCA Healthcare, and AllianceBerstein have established large operations or headquarters, bringing job growth and economic stability to the area. Nashville is also notably the home of Vanderbilt University, one of the top educational institutions in the country. Vanderbilt University Medical Center (VUMC) is Nashville’s largest employer, with over 28,000 employees.
Known as “Music City”, Nashville’s connection to music is significant and undeniable. The city’s countless and growing live music venues, including the Ryman Auditorium, Country Music Hall of Fame and Museum, and honky-tonks of Broadway, draw millions of tourists each year. Last year, more than 17 million visitors descended on Nashville, generating over $10 billion in spending, according to Visit Music City. The city was named the third most popular meetings destination in North America by Cvent, an event planning software company.
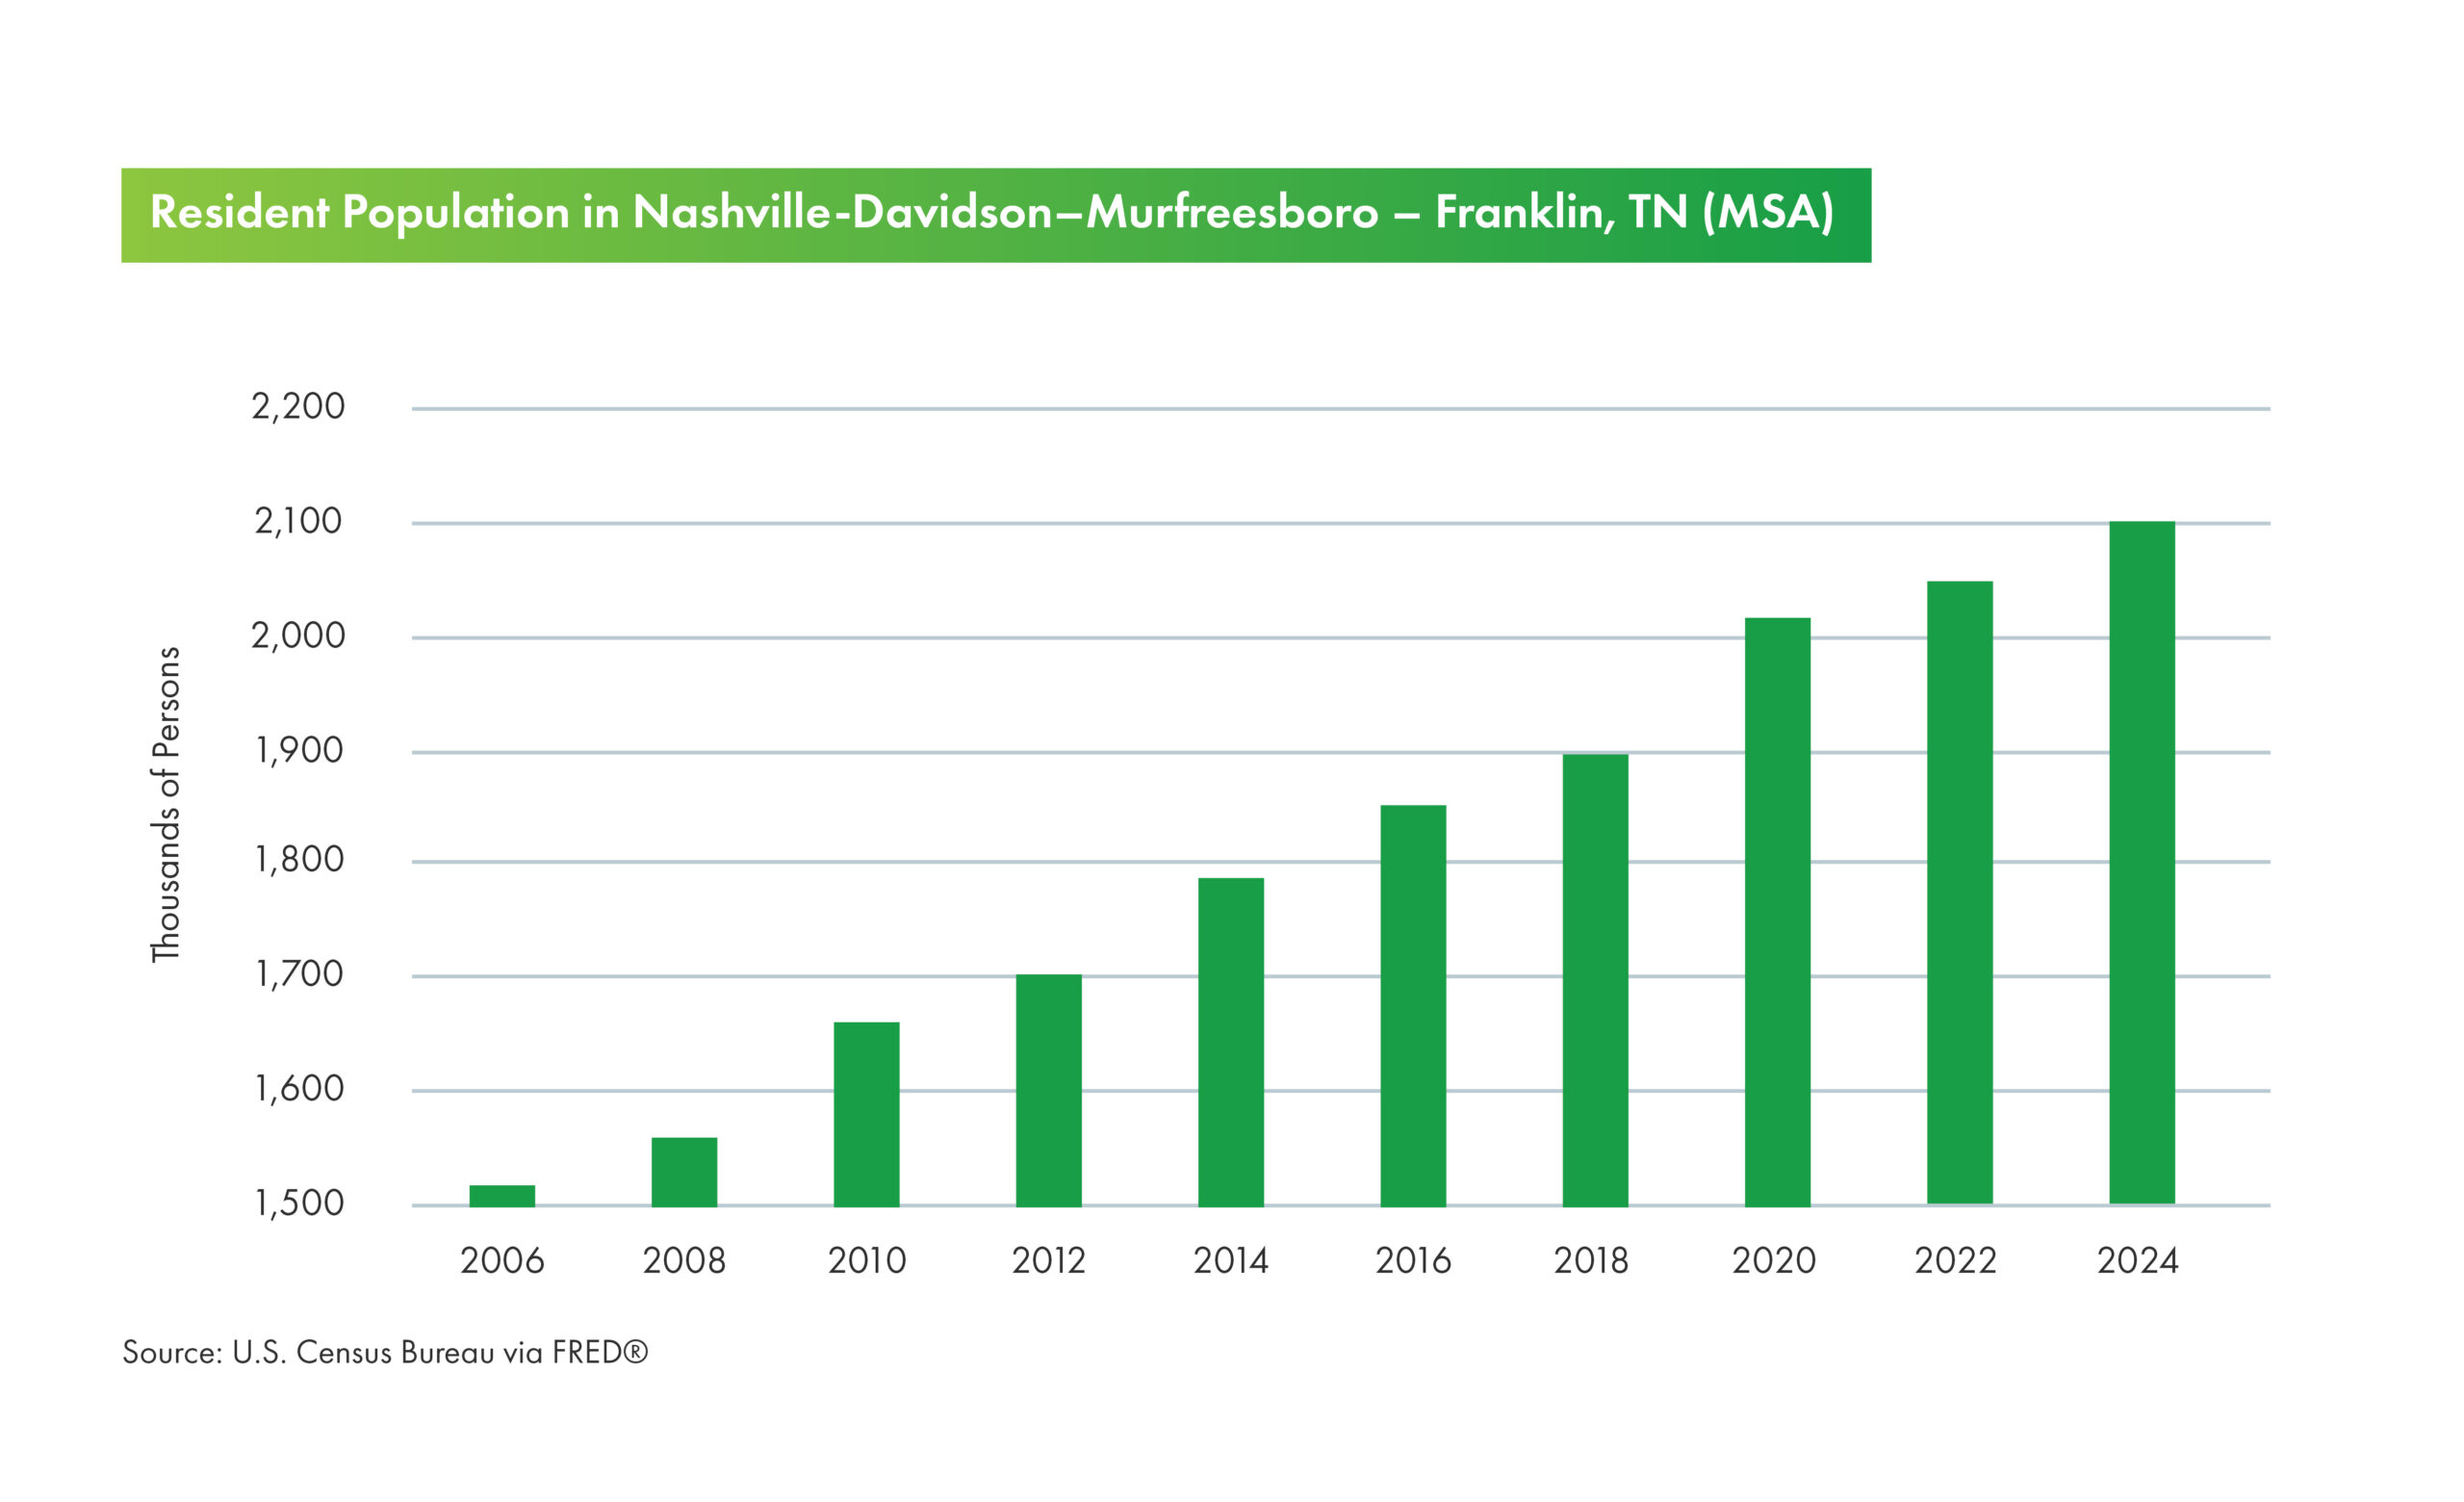
Nashville continues to experience record-level domestic net migration population growth, attracting people with its job opportunities, lively culture, scenic natural beauty, and relatively affordable cost of living. The U.S. is experiencing shifts in migration patterns. While some cities with prior strong migration are now moderating, strong migration continues for Nashville, according to the Urban Land Institute. Tennessee is one of a handful of states with no state income taxes, and reasonable property taxes. This favorable tax environment continues to be a draw for individuals and businesses alike. The resident population in Nashville-Davidson–Murfreesboro – Franklin, TN (MSA) is 2,150,553, according to the U.S. Census Bureau.
Coinciding with new residents and jobs, Nashville experienced a period of rapid multifamily development, leading to a supply demand imbalance and high vacancies. Construction starts have slowed in 2024. Permits for 4,685 multifamily units were issued in the 12 months ending in August 2024, down 4,912 units from the prior year’s sum.
Nashville MSA Key Metrics:
- 2,150,553 Resident Population
- 2.8% Unemployment Rate
- $74,896 Average Household Income
- $1,624 Average Asking Rent
Supply Constraints
Real estate development projects can take several years from planning through construction to final completion and stabilization. As a result, supply imbalances can occur as projects financed during periods of economic growth come online during slowdowns in demand.
Promising secondary and tertiary markets exhibit population growth and economic drivers – the same strong characteristics as primary markets that draw investors and developers. Low interest rates and strong demand following the pandemic have resulted in a huge wave of new supply delivering in recent quarters. This decades-high supply has resulted in rising vacancies and flat or even falling rents in the most oversupplied markets.
However, construction is slowing and the number of projects in the pipeline is falling. Many projects were put on hold on canceled entirely due to dramatic increases in financing and construction costs.
Most major secondary and tertiary investment markets saw a decline in starts beginning around 3Q 2022. The highest level of supply pressures are now decreasing, slightly over two years after the peak of construction starts. In general, the sunbelt markets will be the last to adsorb the excess supply delivered.
Historically, investors have discounted secondary and tertiary markets for a lack of liquidity. Growing interest in these markets for their strong fundamentals has increased liquidity, particularly for well-located, high-quality assets. While institutional buyers pursue centrally located, main and main assets in secondary markets, they typically are not active in suburban submarkets within secondary and tertiary markets. This lack of competition can create opportunities for well-capitalized buyers.
Demographic Trends Driving Growth in Secondary and Tertiary Markets
Demographic trends behind net domestic migration metrics are a key consideration when evaluating investment opportunities. In recent years, and especially since the COVID-19 pandemic, many people have moved away from densely populated urban centers into smaller metropolitan areas.
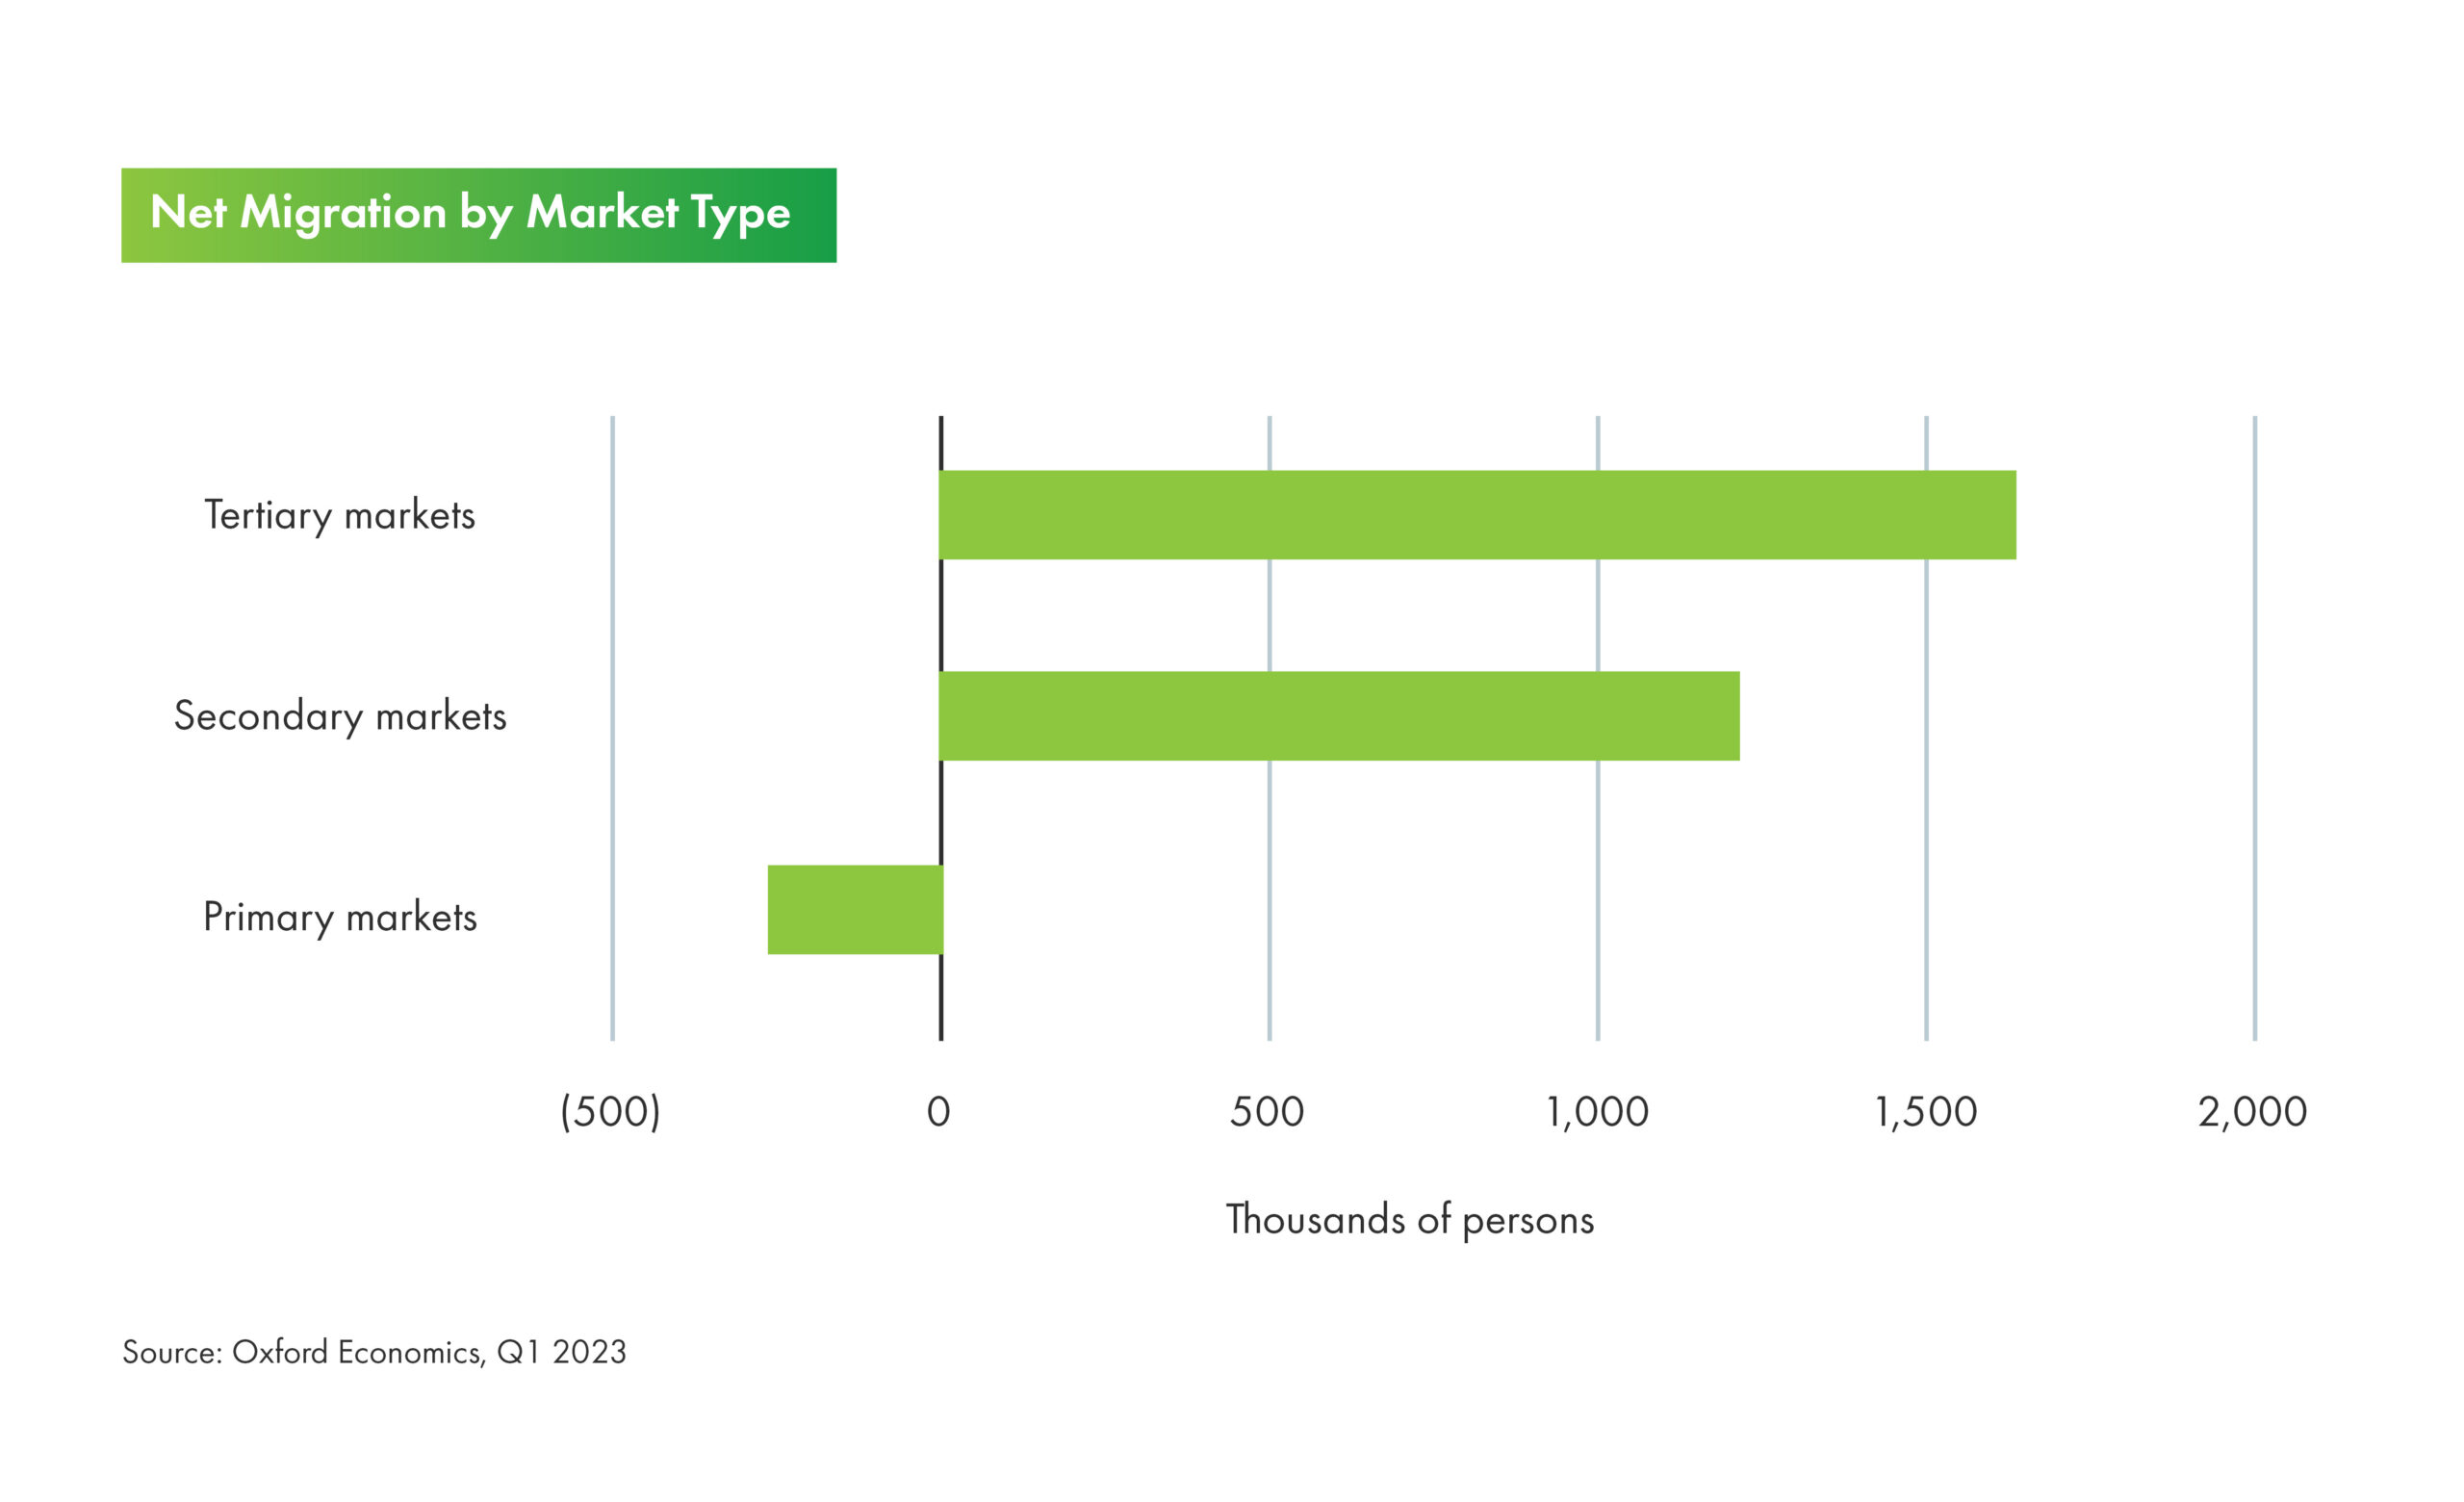
Data from CBRE and Oxford Economics shows tertiary markets have accounted for 62% of total net migration between 2019 and 2022. Secondary Sun Belt Markets such as Austin, Raleigh, and Jacksonville posted 10%-plus population growth from 2017 to 2022. Tertiary markets such as Boise, Idaho; Lakeland, Florida; and Provo, Utah; displayed similar growth in the same period. Texas, North and South Carolina, Florida, and Tennessee led the country in net migration between July 2023 and July 2024.

Affordability
Renters and buyers alike are migrating in pursuit of affordability. In fast-growing metro areas, the shortage of housing has made it increasingly expensive to buy and rent homes, forcing many potential home buyers to relocate to nearby, smaller markets with more affordable homes. Households are leaving high-priced markets like Orlando and moving to nearby Lakeland, Ocala, and Daytona Beach.
Remote Work
A study by the Federal Reserve Bank of St. Louis found that relative to commuters, remote workers are more likely to relocate for reasons related to housing or family, whereas commuters are primarily motivated by job opportunities. Remote workers seek out locations with affordable housing. Work from home (WFH) remaining a popular option since the COVID-19 pandemic will continue to have substantial impacts on net migration patterns.
Aging Population
More than 3 million adults age 65 and older move ever year. The southern and western “Sun Belt” states are the most popular destinations for older adults who move, offering low-income taxes, milder weather, and affordable housing markets. These retirees no longer need to be near urban employment centers and instead prioritize proximity to quality healthcare, recreation, and lifestyle amenities.
The Appeal of Garden-style Multifamily Properties
Garden-style multifamily properties are increasingly one of the most desirable investment assets. These properties typically consist of multiple low-rise buildings with three or fewer stories, and feature common outdoor amenities including clubhouses, pools, athletic courts, and entertaining areas.
Often located on the perimeter of urban areas, or in the suburbs entirely, garden-style properties offer the potential for strong risk-adjusted returns and can often be purchased at a discount to urban, primary market assets. Over the past decade, garden-style properties have outperformed high-rise apartments according to the NCREIF Property Index.
When considering new investments, garden-style properties offer more predictable underwriting. The low-rise and compact nature of the buildings make elevators less common in these properties. Potential major capital expenses such as HVAC, roofs, and plumbing have predictable useful lives, especially for owners and operators with proprietary expertise gathered over decades of property and asset management.
Maximizing Returns Through Scale in a Market
For multifamily owner-operators, achieving scale within a targeted region or market can provide significant operational efficiencies and enhance portfolio performance. Leading real estate investment trusts (REITs) are increasingly adopting a centralized, hub-based property management model. Multifamily operators can streamline administrative and operational support functions for a group of properties in a specific region by consolidating them into a centralized hub.
AvalonBay Communities, a publicly traded REIT, first established its “neighborhood operating model” in 2007, which groups up to five properties (or 1,500 units) under one service team at a centralized customer care center. This team handles services like rent payments and maintenance requests—previously managed at individual properties—improving response times and tenant satisfaction while cutting operational expenses. AvalonBay even operates some communities without any full-time on-site staff: maintenance support is scheduled a few times a week, and emergency maintenance support is available as needed.
While this model isn’t viable for all operators, it demonstrates opportunities for savings through scale and improving response times to resident requests.
Beyond operational efficiencies, a centralized model provides financial advantages through improved purchasing power with vendors. By consolidating maintenance service contracts or technology equipment upgrades across multiple properties, operators can negotiable bulk pricing and favorable terms with vendors.
Finally, operating at scale in a region can provide data on occupancy trends, rent growth, and expense costs across properties. This internal proprietary data offers advantages over external database services, especially in secondary and tertiary markets with less readily available data, providing real-time, granular data and ultimately improving confidence regarding pricing strategies and investment valuations.
References
CBRE. Navigating opportunities in secondary and tertiary retail markets.
Milken Institute. 2025 best-performing cities: Mapping economic growth across U.S.
Visit Music City. Strong tourism results continue to drive Nashville’s economic success.
Federal Reserve Bank of St. Louis. Nashville-Davidson–Murfreesboro–Franklin, TN Metropolitan Statistical Area Population.
Yardi Matrix. Nashville multifamily market report.
PwC. Emerging trends in real estate: United States and Canada 2025.
RealPage. 4Q 2024 data update.
CBRE. U.S. real estate market outlook 2024: Multifamily.
CBRE. U.S. multifamily recovery gains momentum as vacancy rate falls, absorption surges.
Federal Reserve Bank of St. Louis. Why do WFH workers move?
National Institute on Aging. Census bureau releases report on domestic migration of older Americans.
YardiKube. Remote workers leading the migration across state lines.
Freddie Mac. In pursuit of affordable housing: Migration among homebuyers within the U.S.
U.S. Census Bureau. U.S. census bureau releases population estimates of international migration.
JBREC. 3 migration shifts shaping housing markets in 2024.
RealPage. Garden apartments outshine taller properties.
Freddie Mac. 2025 multifamily outlook.
AvalonBay Communities, Inc. Investor Presentation November 15, 2024.
NCREIF Property Index, Q2 2024.
Download a formatted PDF of this article