
Introduction
In real estate investments, success is primarily defined by increasing net operating income (NOI), a metric that measures a property’s profitability by subtracting all operating expenses from total revenue generated (mainly rent). Rent growth is the primary driver of increased revenue, and a product of supply and demand factors. When demand for housing in a particular market is high and the supply of available units is low, rent growth is possible. This white paper will provide an in-depth analysis of the demographic trends driving robust and sustained demand for rental housing, with a focus on secondary and tertiary markets in the central and southeastern United States. The widening gap between the cost of homeownership and household incomes, along with preferences of millennial’s and Gen Z, mean renting is the most practical and appealing option for many today. Living in a smaller city may have meant career sacrifices in the past, but that is changing quickly as employers are drawn to pools of well-educated workers who are choosing to live in areas with a high quality of life. These long-term trends are structural changes affecting the American housing market, favoring rental housing in high-growth markets.
Homeownership Affordability
The significant gap between the cost of homeownership and the cost of renting has pushed homeownership out of reach for many people. Home prices have grown much faster than median household incomes. The Case-Shiller Home Price Index is a widely recognized measure of the price level of existing single-family homes in the United States. Historically, the average cost of a house in the US has been around 5 times the yearly average household income. During the housing bubble of 2006, this ratio exceeded 7 at its peak. Today, this ratio is even higher, measured at 7.29 as of May 31, 2025. In major metropolitan areas, this ratio is even more extreme. There is strong demand for starter homes from first-time buyers, but builders are concentrating on more profitable, higher-end properties. This leaves a significant gap in the for-sale housing stock. Central and southeast markets have not been immune from the rapid home price appreciation, but still offers relative value compared to coastal cities, drawing renter-by-necessity and renter-by-choice populations.

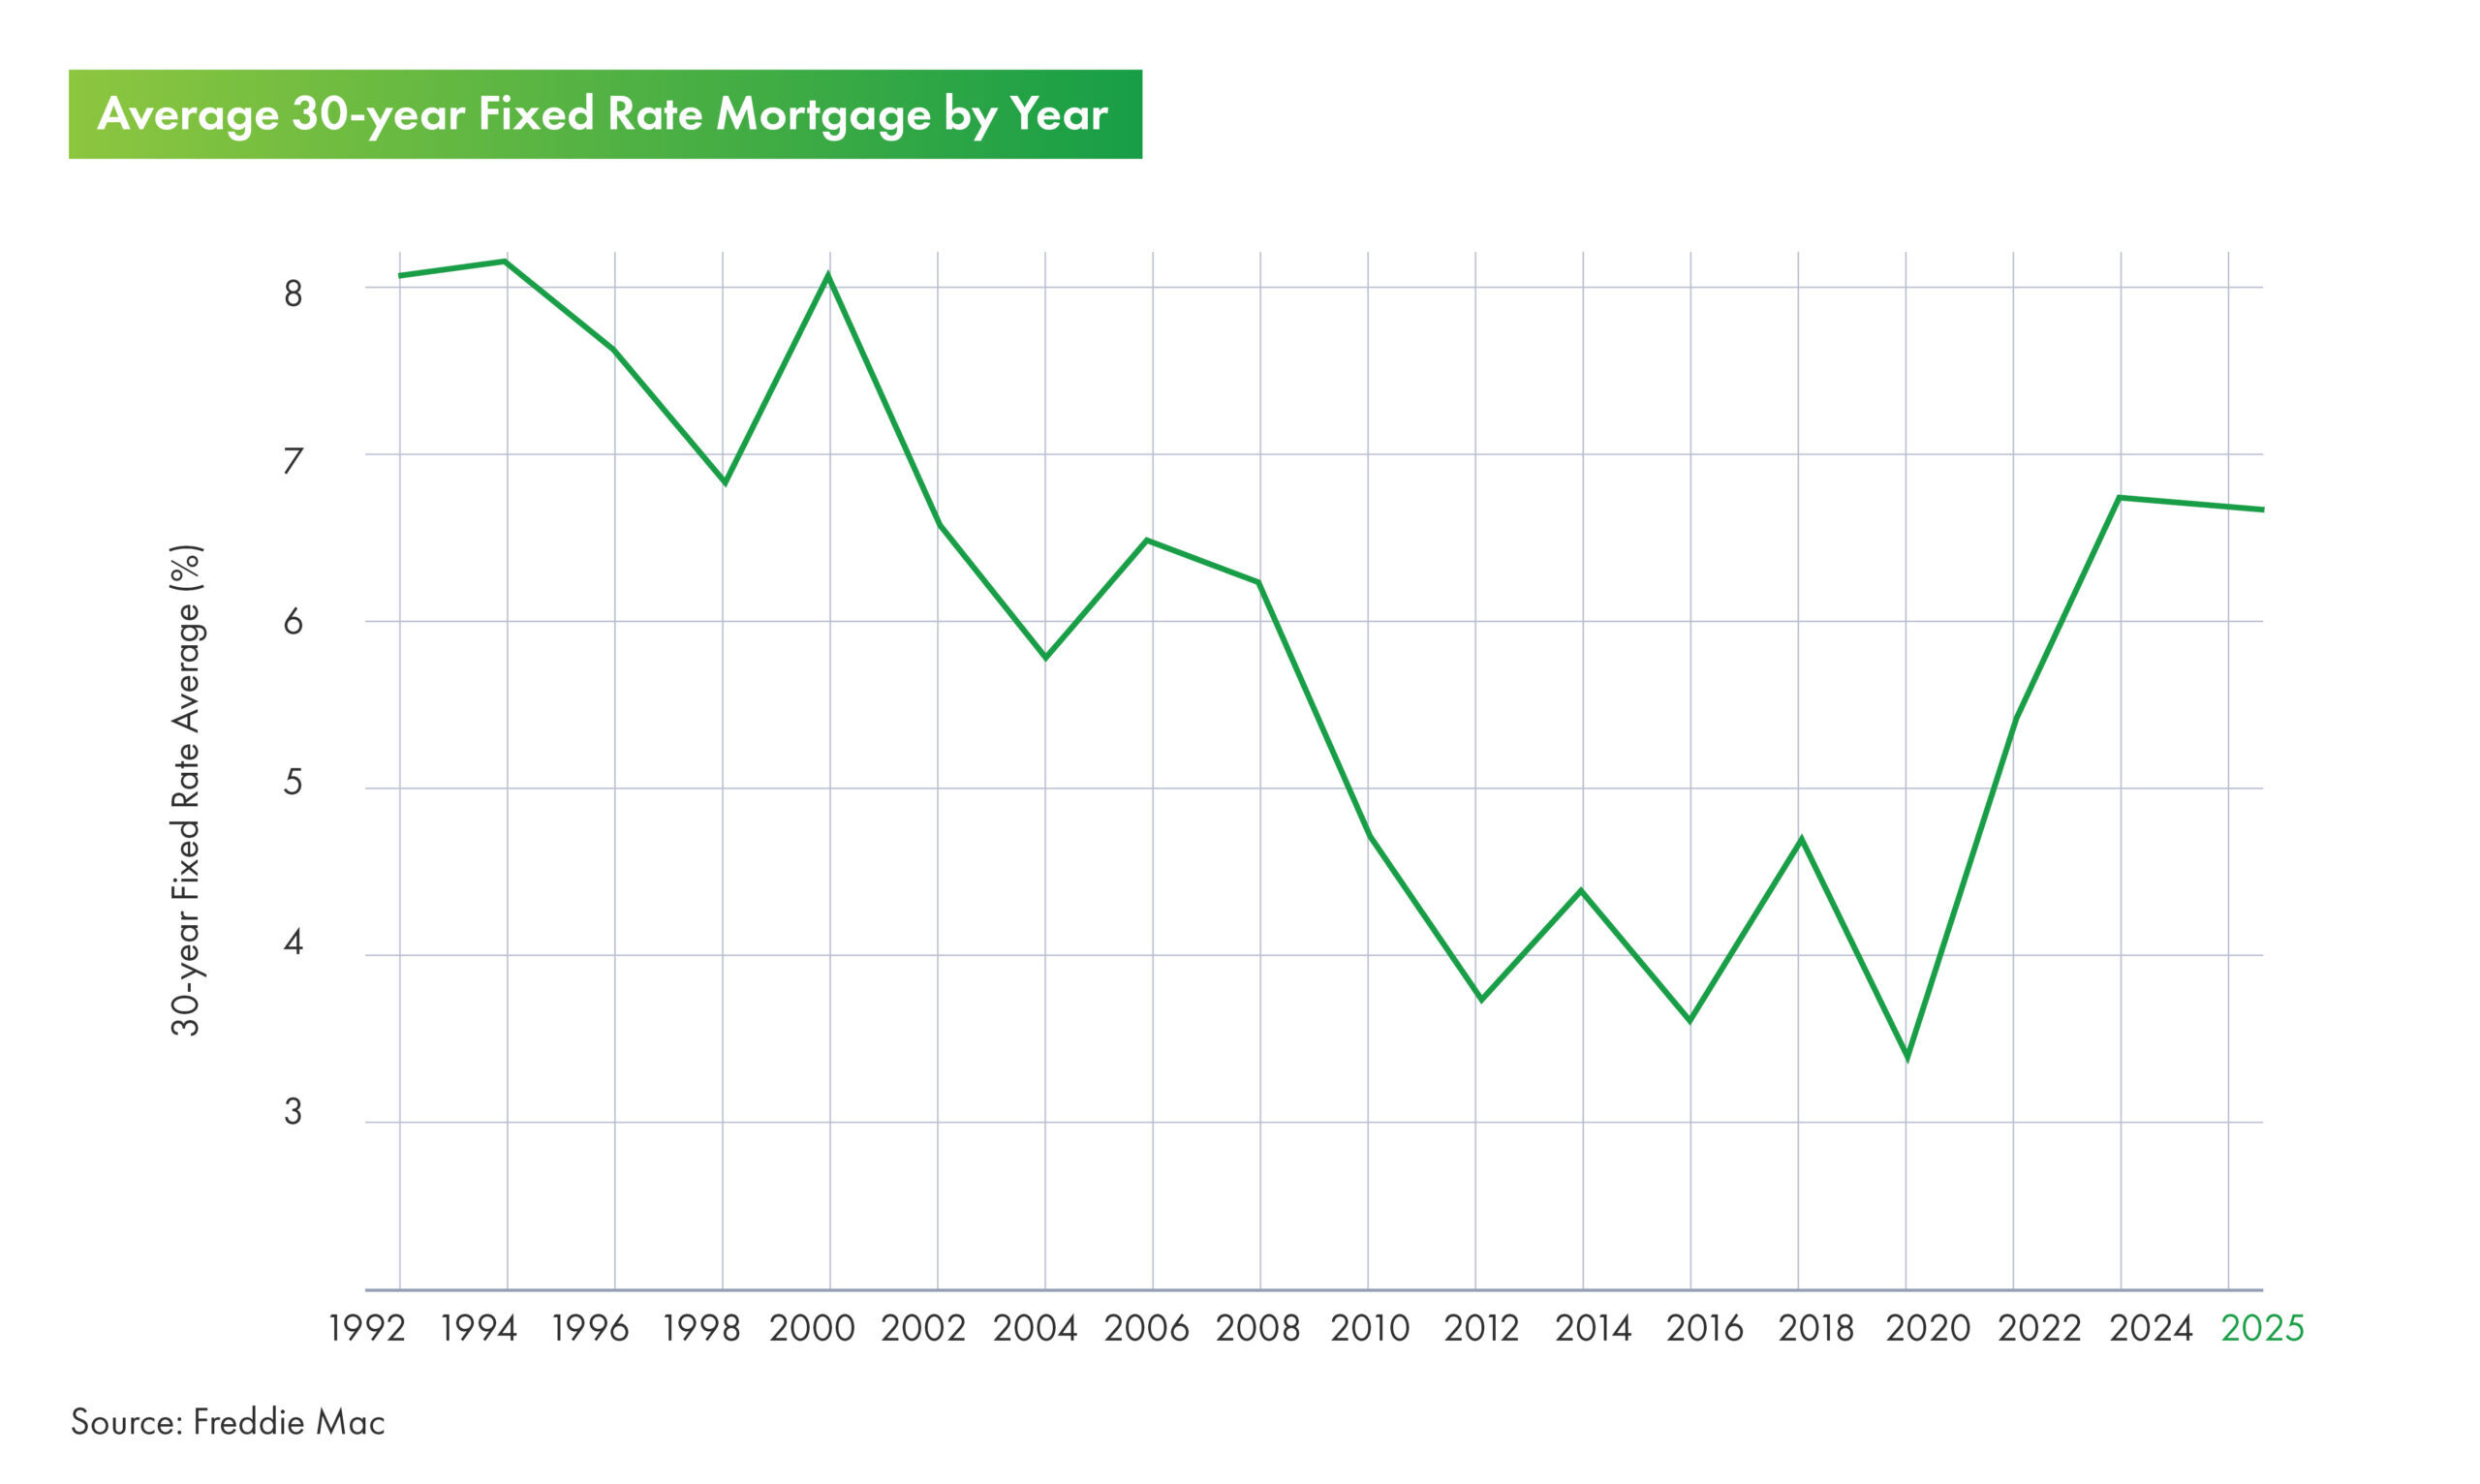
After the COVID-19 pandemic, inflation soared to levels not seen since the 1980s. To cool down the economy and ease these pricing pressures, the Federal Reserve implemented the fastest and largest increase in its federal funds rate in four decades. Between March of 2022 and July 2023, the federal funds rate increased from 0% to 5.25%. Today, this rate sits around 4.25%-4.50%. This higher cost of borrowing means higher monthly mortgage payments, making a home purchase prohibitively more expensive for most people. The result is a dramatic divergence between the costs of owning and renting. As of mid-2025, the monthly cost gap between renting and owning was approximately $1,240, 10x higher than in 2015 when it was $111, according to RealPage and Freddie Mac data. This gap is not expected to close anytime soon, due to the “lock-in” effect. Current homeowners who purchased with or refinanced into low-interest mortgages are reluctant to sell, and buy a new home at today’s higher rates. This reduces the supply of existing homes on the for-sale market and keeps prices elevated.
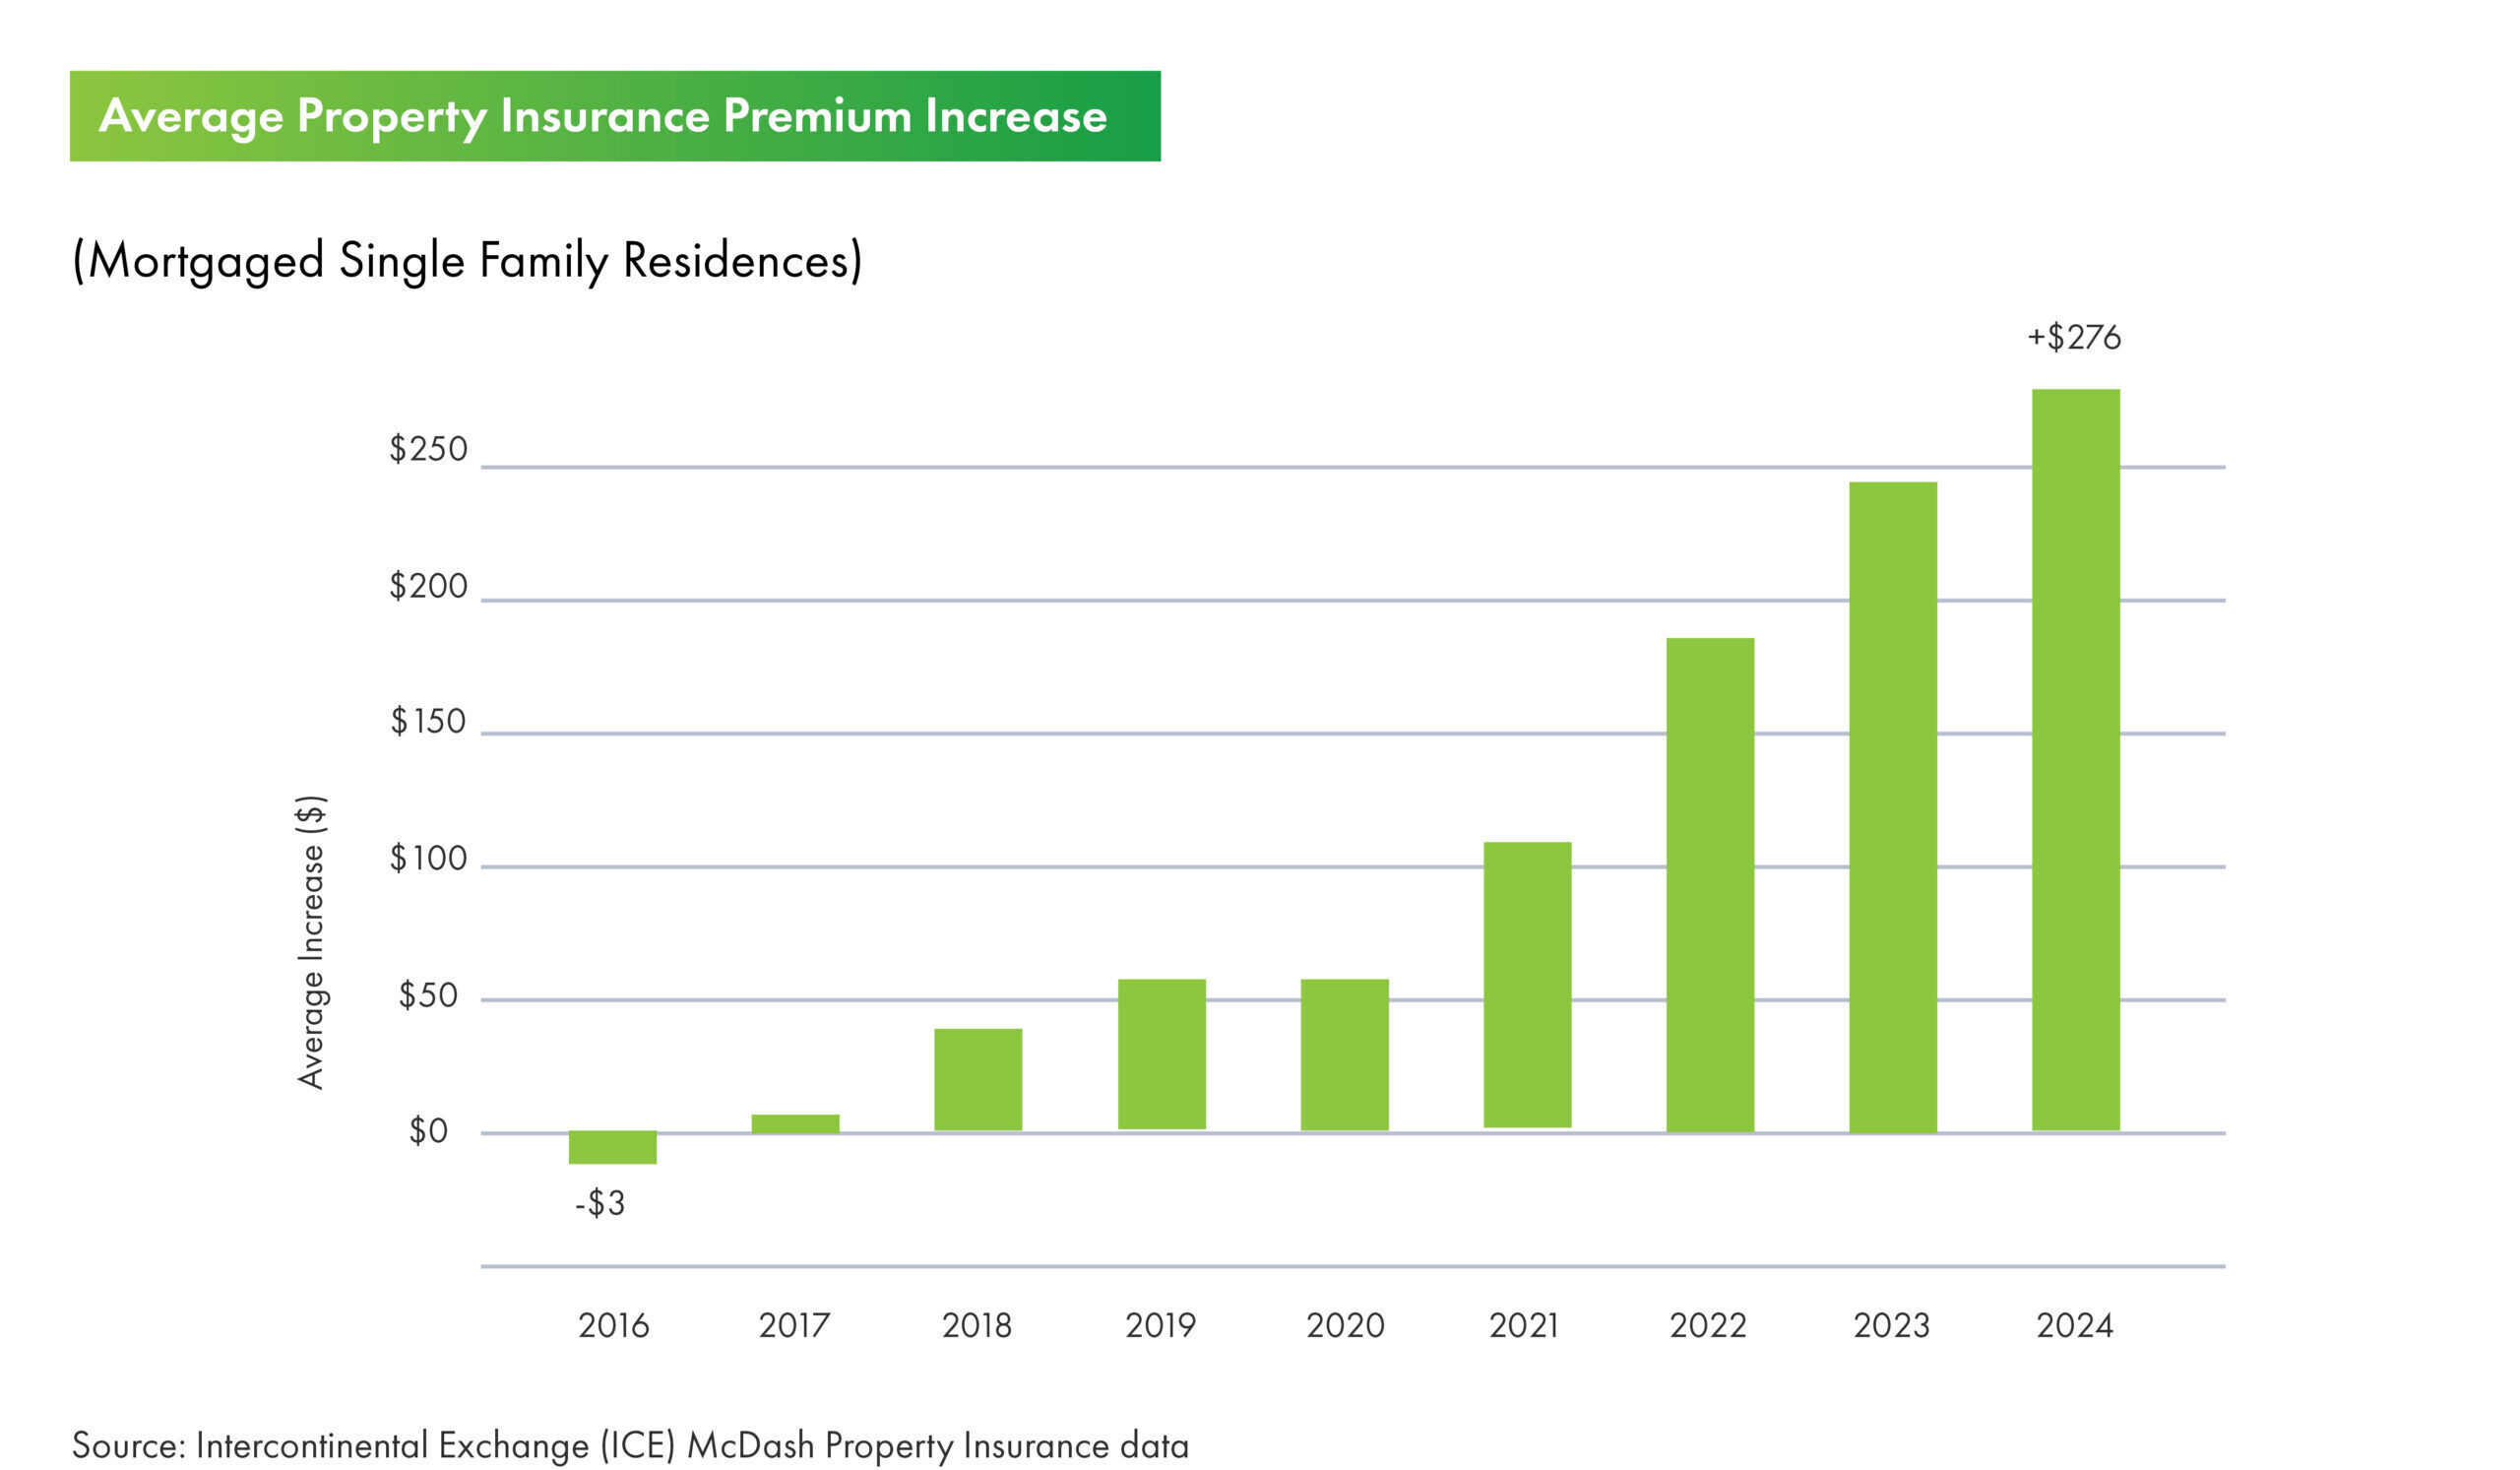
It’s not just the initial down payment and mortgage costs. The ongoing costs of home ownership have also been climbing. Both property taxes and homeowners’ insurance premiums have increased significantly in recent years. Since property taxes are calculated based on assessed value, the increase in home prices has led to higher assessed values and higher tax bills. Property taxes are the largest source of tax revenue for state and local governments, and many municipalities have increased property tax rates to fund public services spending. According to CoreLogic, national property tax payments rose an average of 5.5% from 2023 to 2024, and 27.4% since 2019. More frequent and severe natural disasters are leading to greater losses for insurers, who spread those losses across all their policyholders. Wildfires in California or hurricanes in Florida are contributing to higher monthly insurance costs for homeowners nationwide. On average, homeowners saw a 12 percent increase in premiums in 2023 and an additional 6.9 percent increase in the first half of 2024. Overall, insurance premiums have risen between 24% to over 50% in extreme cases over the last five years.
With the cost of labor and materials for repairs also on the rise, the cost of maintaining a home is another burden. While financial experts suggest setting aside 1% to 4% of a home’s value to cover maintenance and unexpected repairs, specific costs will depend on home age, climate, and materials used. In smaller markets with more limited tradespeople, the costs for maintenance can be even higher.
Migration Trends
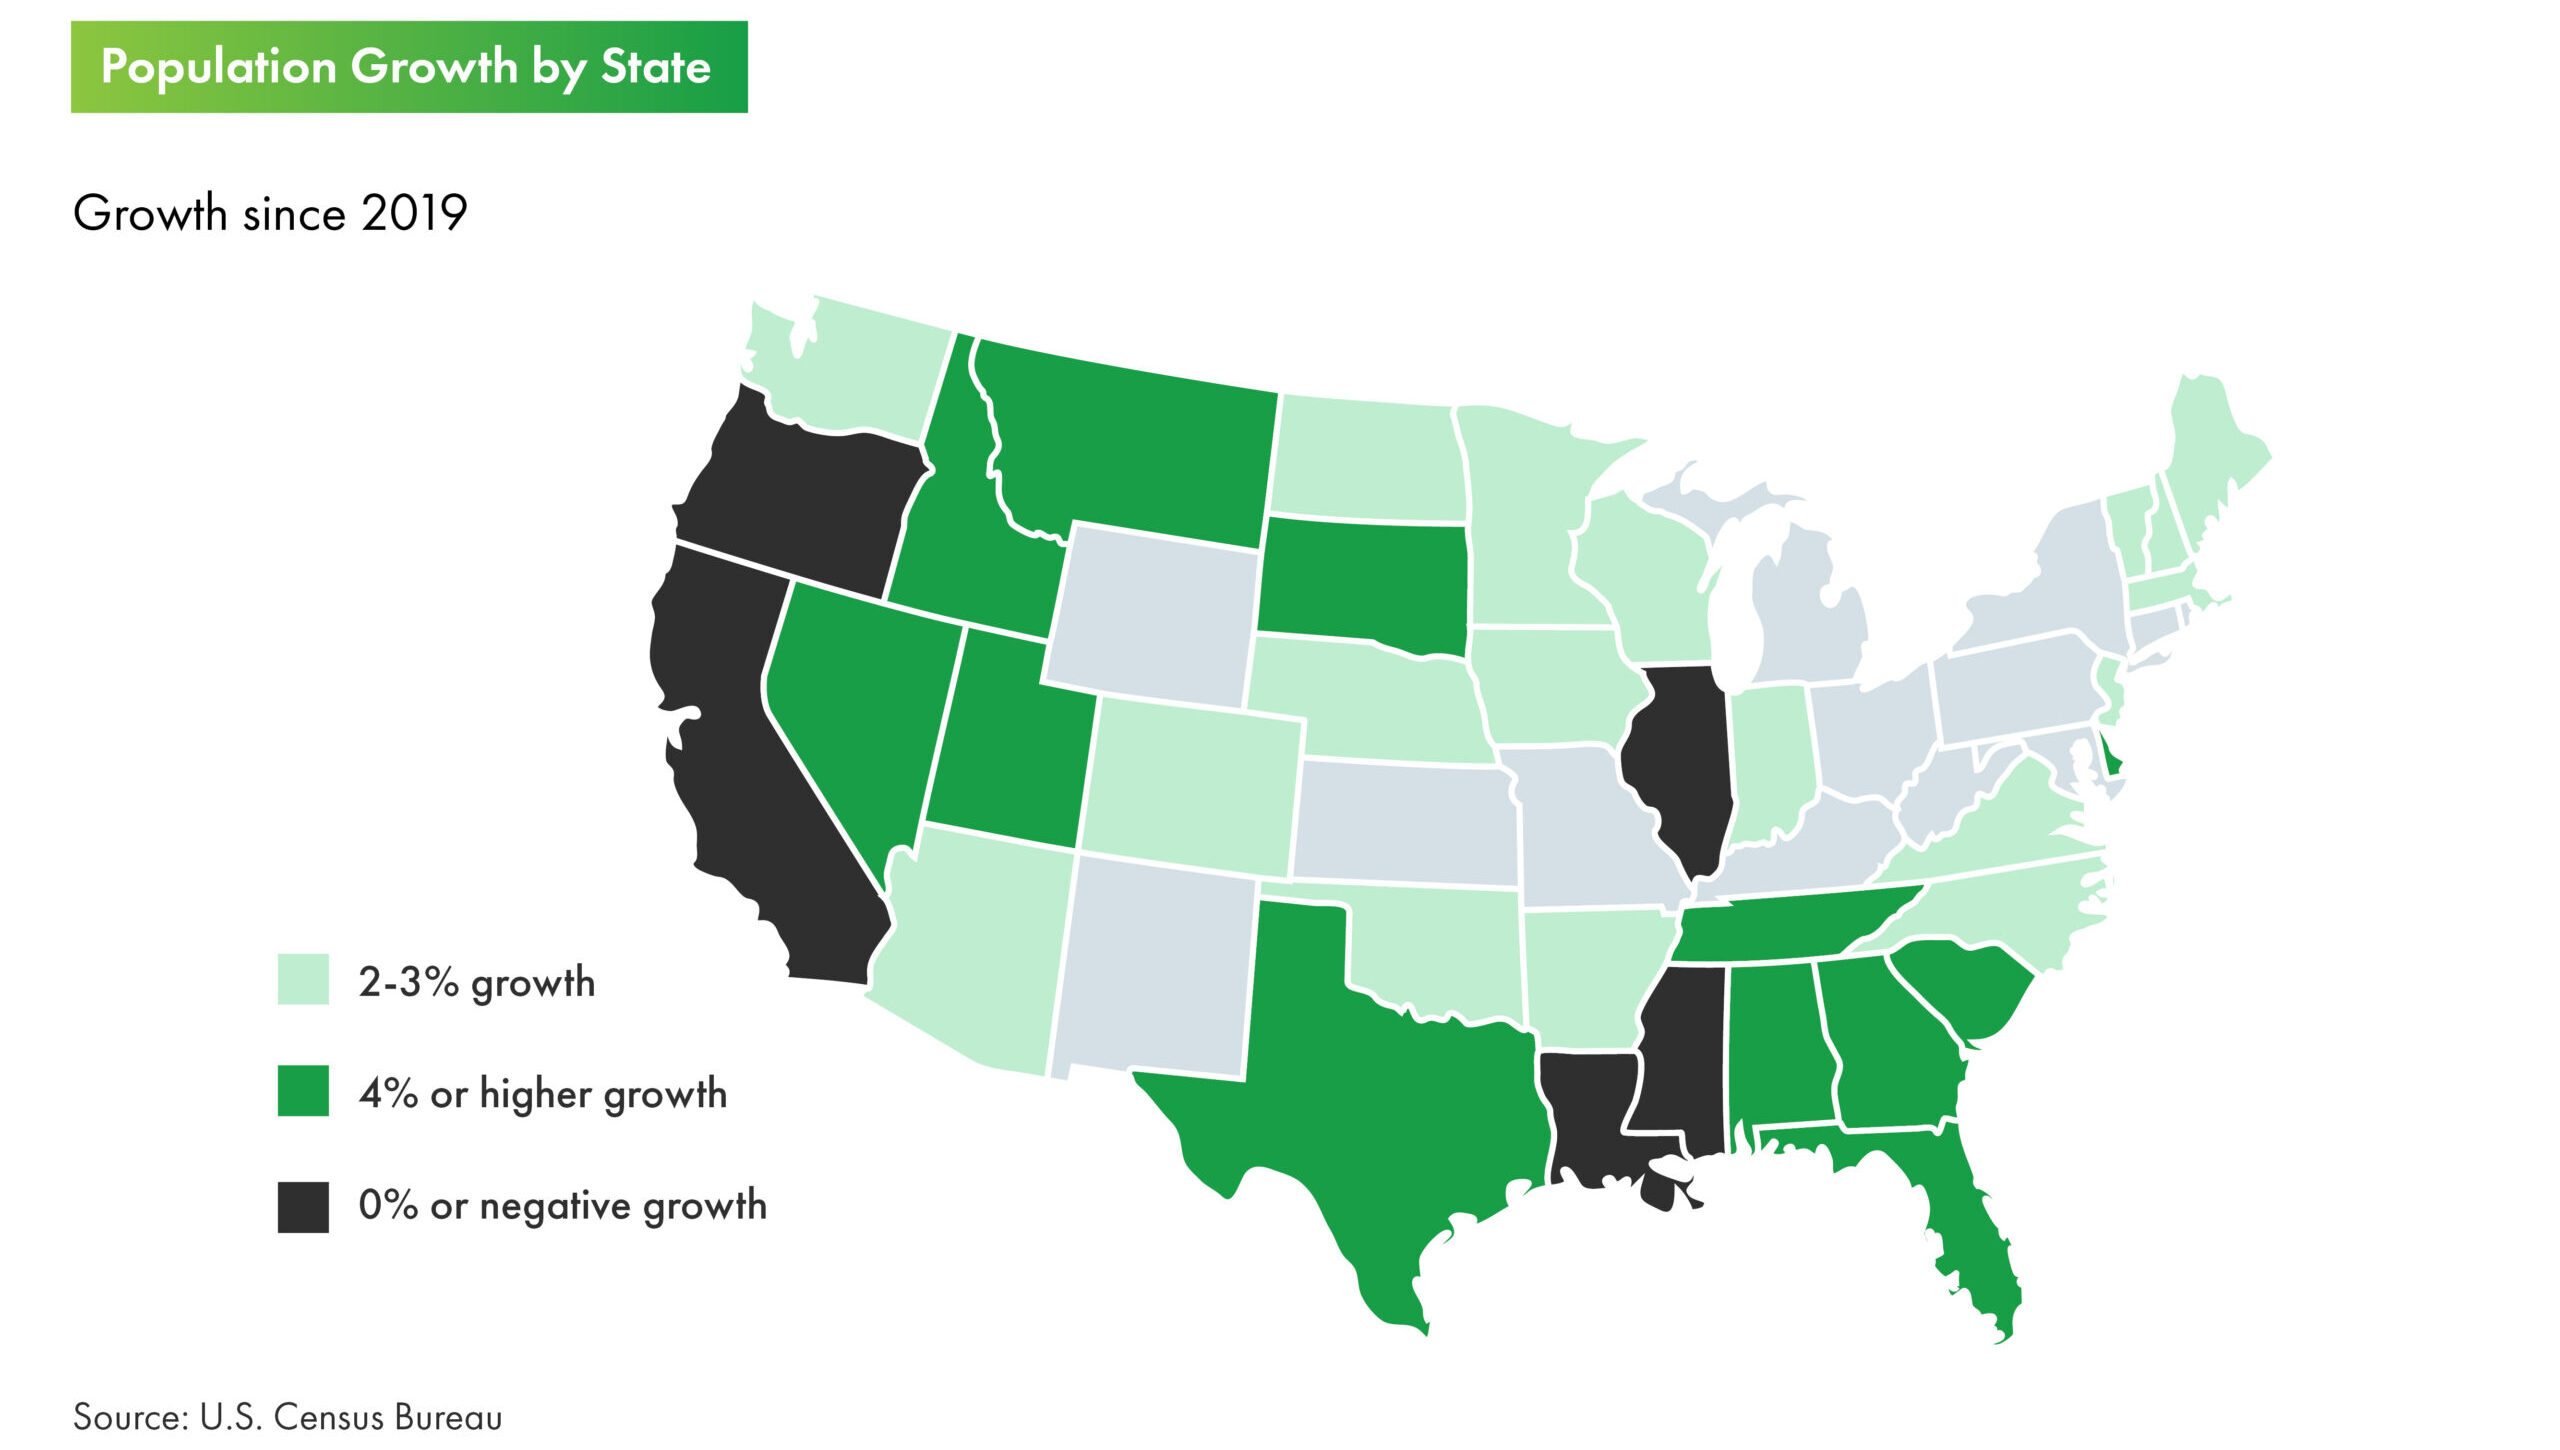
Even since before the pandemic, individuals and families were moving from high-cost-of-living states, such as California and New York, to more affordable central and southeast states, such as Texas, North Carolina, Tennessee, Florida and Arkansas.
In the past, prioritizing lifestyle and cost of living, away from headquarters offices meant sacrificing career opportunities. Since the pandemic, this is less the case and migration has accelerated. Pro-business states have become dominant financial, healthcare, and technology centers with a growing concentration of high-paying jobs. In recent years, numerous companies have moved or announced moves to central and southeast states. Oracle announced it would be moving its world headquarters to Nashville, in part to be closer to a major health-care epicenter. As an enterprise software company, Oracle’s products include software for electronic healthcare records (EHR). In-N-Out Burger announced it was opening a new regional office in Franklin, Tennessee, to support the company’s expansion into the Eastern part of the United States. AllianceBerstein, a global asset management firm, relocated its headquarters to Nashville from New York City. “Years ago, you really needed to be in New York for a big job. That has all changed,” said Elaine Agather, Chairman of the Dallas Region for JP Morgan. In addition, young professionals are not only moving to these cities for their affordable cost of living, but also for the social and cultural amenities they offer.
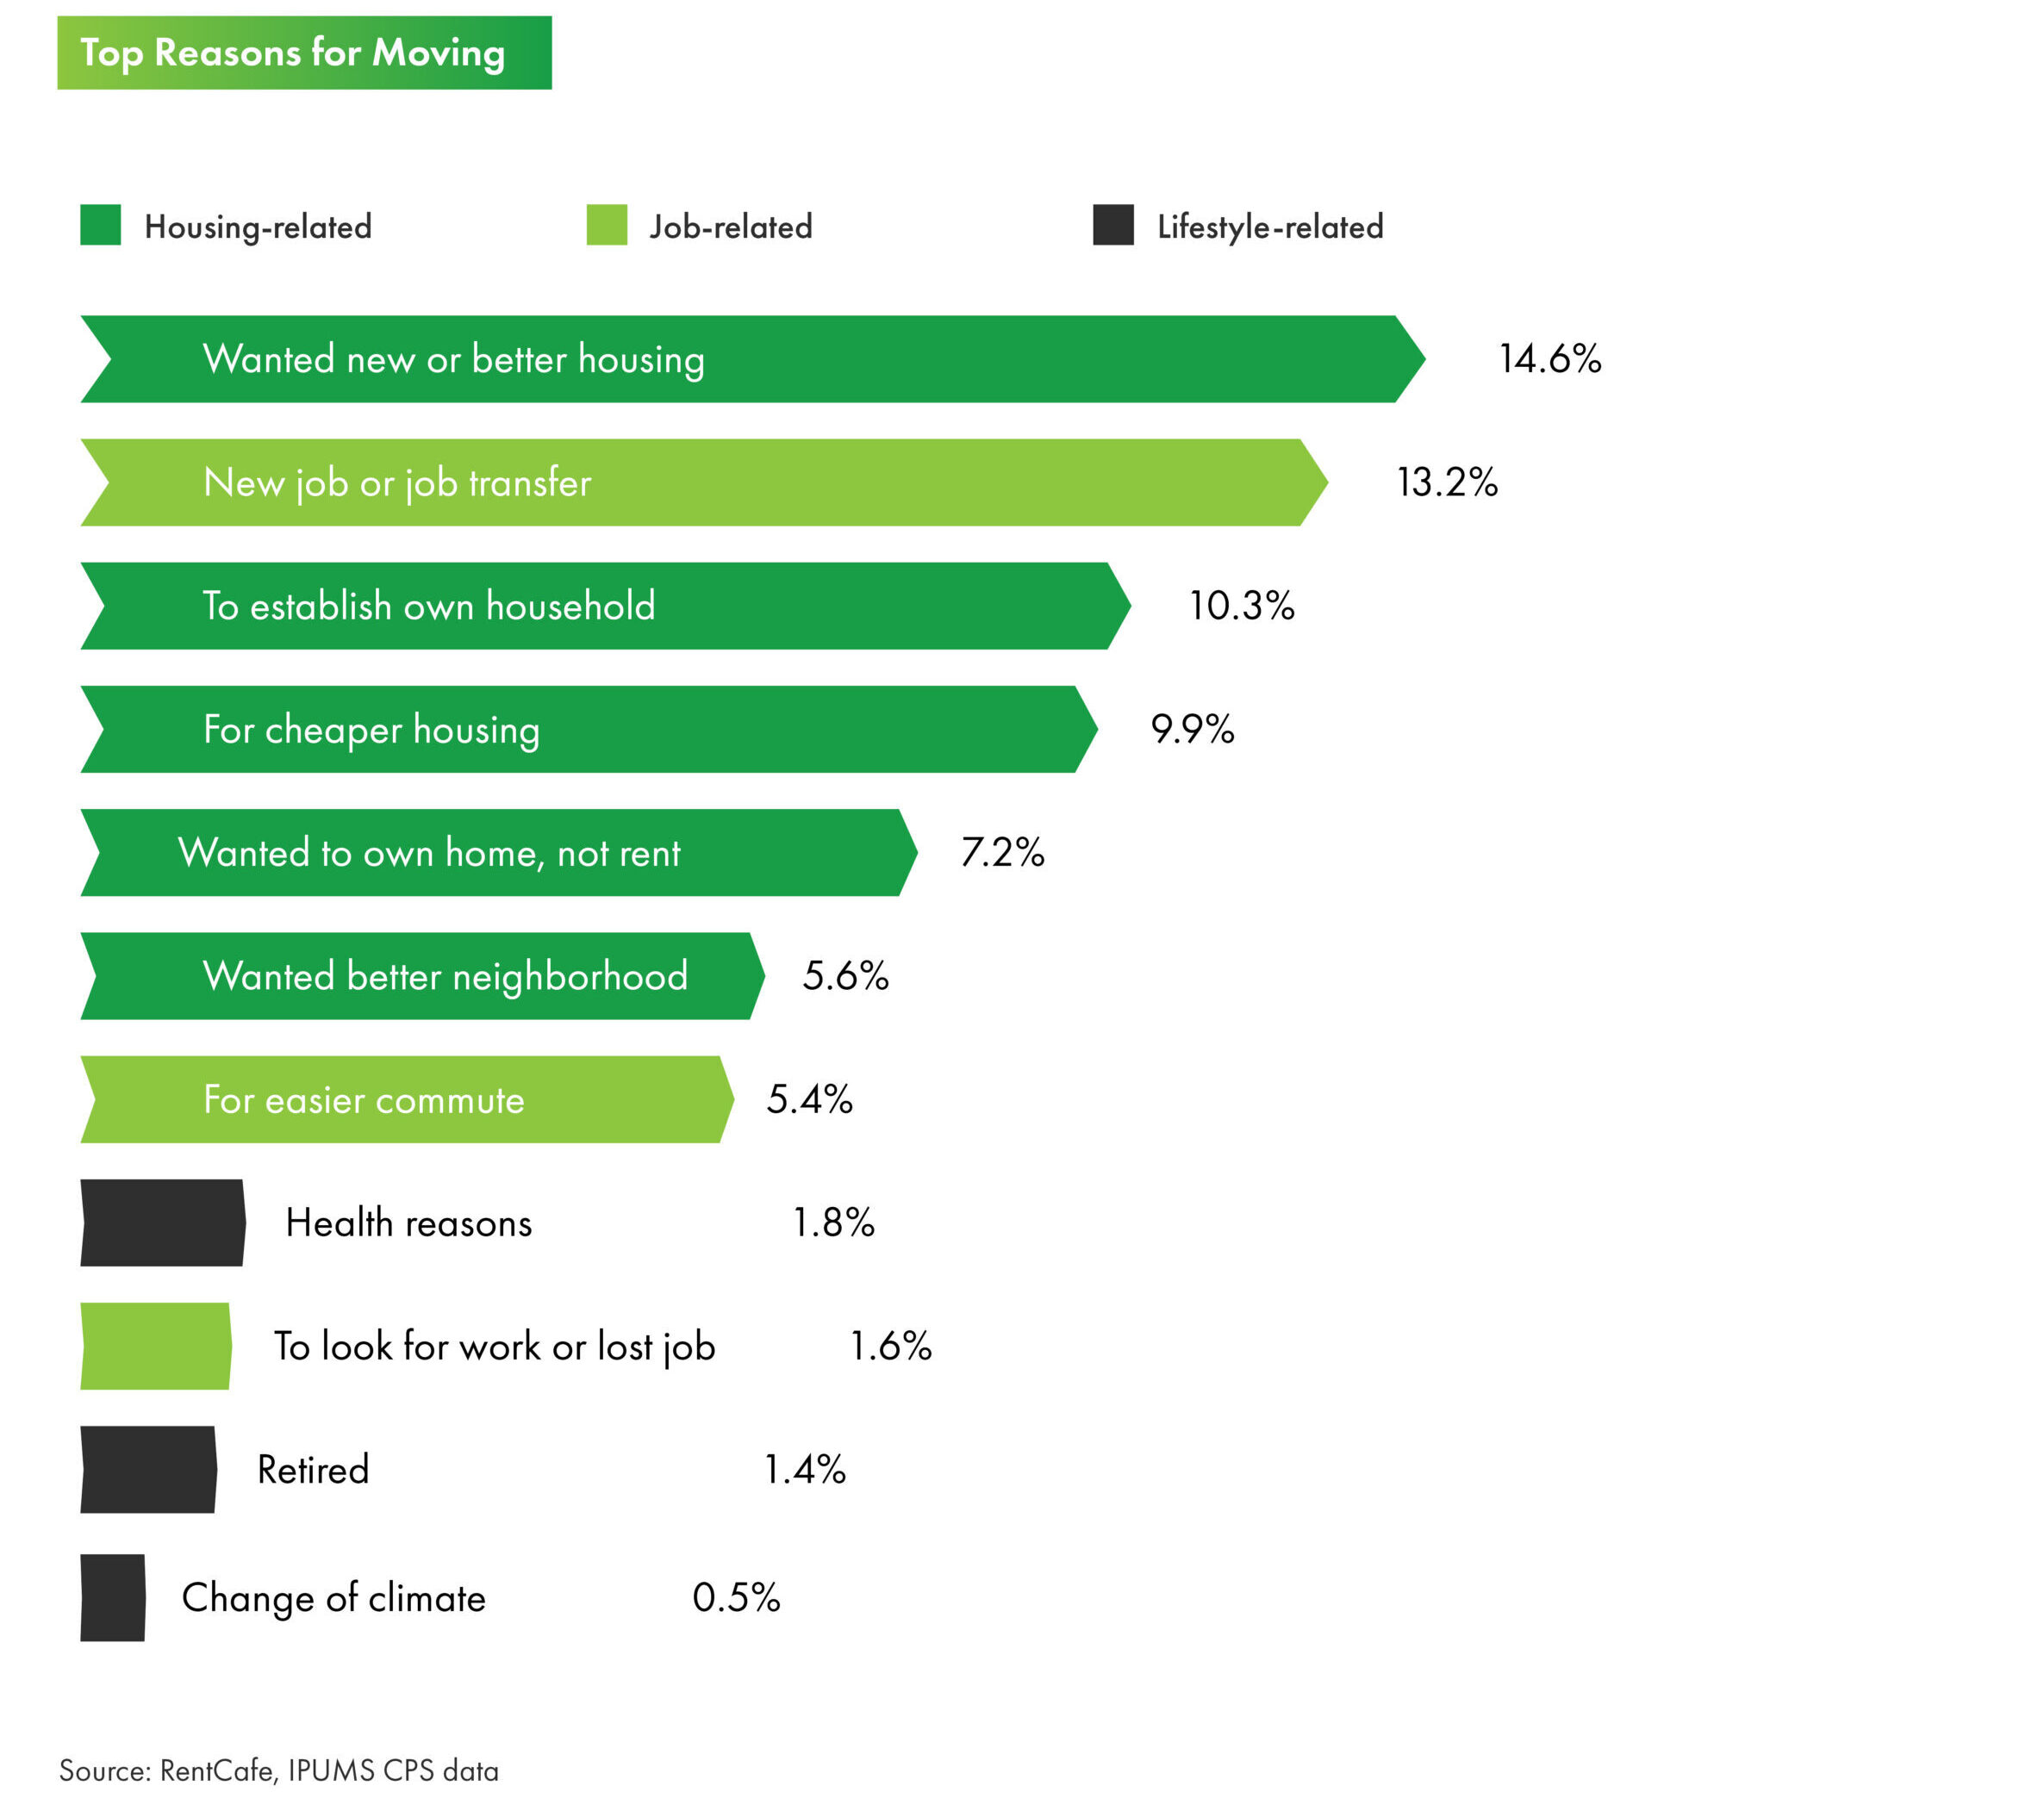
The majority of net domestic migration since 2020 has been to secondary and tertiary markets. According to Oxford Economics, tertiary markets accounted for 62% of total net migration between 2019 and 2022. Housing-related reasons are the primary reasons for why people move. In secondary and tertiary market, people can afford to rent more space compared to in primary markets. For example, Realtor.com says the average price per square foot for a home in Nashville was $307 based on median listing prices, compared to $691 in Los Angeles. Quality of life is another frequently cited reason for the growth of these smaller cities. While secondary and tertiary cities typically lack the extensive public transportation infrastructure of primary cities, they may be have less congestion, allowing for easier and shorter commutes. Finally, with less industrial activity, smaller cities typically have cleaner air and offer a healthier environment surrounded by nature for lifestyle activities.
Renters by Choice
More Americans are choosing to rent, even if they can afford to purchase a home.
This trend reflects the preferences and life stages of large generational cohorts like Millennials and Gen Z, who are delaying marriage and choosing to spend their discretionary income on travel and other experiences. The median age of home buyers has increased to 56 in 2024, up from 25 in 2021, according to NAR’s Profile of Home Buyers and Sellers. Similarly, the median age of first-time homeowners in the U.S. is 38 years old. This is nearly a decade older than the typical first-type buyer in the 1980s, who was usually in their late 20s. As individuals pursue marriage and parenthood later in life, they are renting apartments for more years than in the past.
Pew Research says that a third of today’s renters are renting by choice and not circumstance. This is due to a mix of practical, financial and lifestyle choices. Renting provides flexibility and mobility in contrast to the perceived stability of homeownership. Renters can quickly move for job opportunities or personal reasons, without selling or renting their home. For young, single professionals or those in professions not tied to one physical office, this proves appealing. Renters are less susceptible to unexpected expenses like repairs or increases in insurance. They also don’t have to spend time and money on maintenance, such as landscaping or seasonal clean up. The amenities offered by rental housing are an additional appeal. Residents can save time and money with on-site gyms and entertainment facilities.
Overall, considering the price and commitment of homeownership, contrasted with the convenience of renting, it makes sense why homeownership is less desirable for an increasingly large segment of the population. Entrata, the property management software company, said in its “The New American Dream Report” that 41% of renters claim their American Dream has nothing to do with homeownership, and 20% anticipate being lifelong renters.
